Two screens, one match: how we convinced TIM
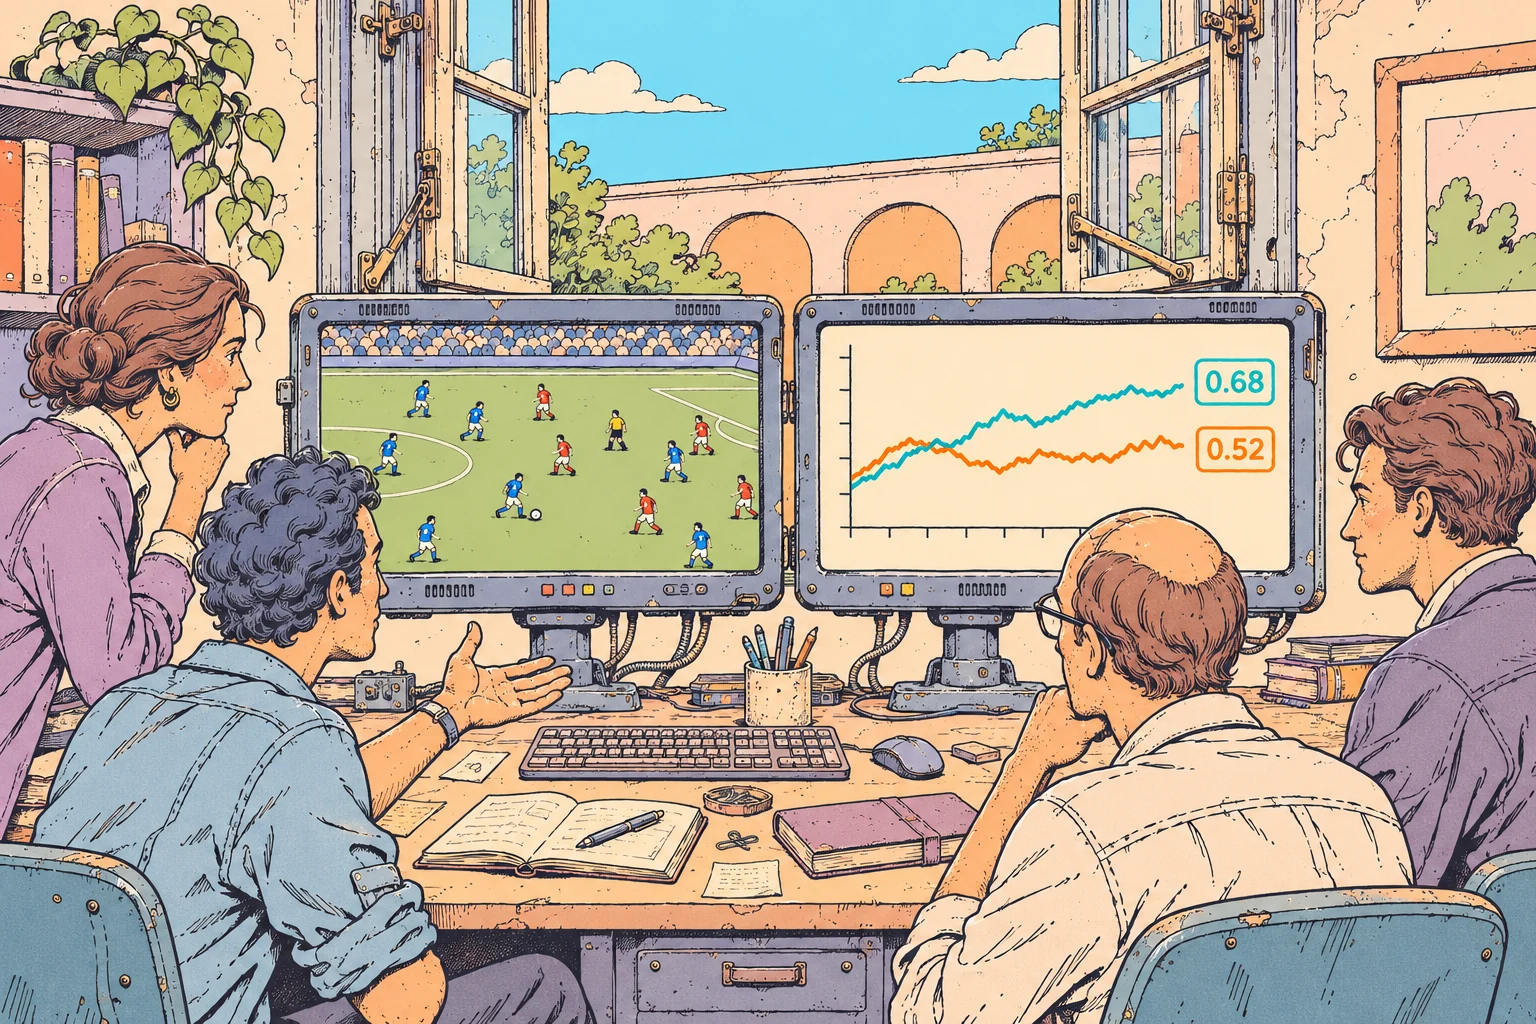
We invited TIM executives to watch Italy play Costa Rica. On one screen was the match. On the other were two numbers, one for each team's performance, moving through time like prices on a financial chart.
That was our demonstration of INNAAS. All the complexity of a football match, condensed into something you could read in a second.
It was 20 June 2014. Giuseppe and I were trying to turn our technology into a business, and 2014 was the year of our first real project. We had plenty to explain: the data, the models, the different places where the technology could be useful. Football gave us a way to put all of that in front of people who already cared about the answer.
Everyone watching had an opinion about Italy. Nobody needed an introduction to the problem. Who was playing better? Was the pressure actually producing anything? Did the impression we were getting from the television survive a look at the data?
I still like the audacity of it. We bought the sports dataset ourselves from a specialist provider and built the demonstration around a live match. The executives could look from the game to our curves and back again. The thing we were measuring was happening in front of them. I later described that afternoon in this interview with EconomyUp.
Two numbers sound almost offensively simple after you have spent so much effort building the machinery behind them. But that compression was the work. A long table of events would have left the audience to do the interpretation. We wanted to give them a useful reading of the game while there was still a game to watch.
The difficulty is deciding what deserves to survive that compression. Possession, for example, can tell you something, but a team can keep the ball without doing much with it. Counting more things does not automatically resolve the problem. You have to decide how they relate to performance, and you have to be prepared to explain that decision.
That interested me much more than the size of the dataset. There is something very satisfying about taking a mass of observations and finding a signal that another person can actually use. The final display should be easy to read. The reasoning behind it has to earn that simplicity.
There was also a useful discipline in showing it live. We were exposing our interpretation to people who could compare it with their own eyes. If a curve moved, the match was right there. We had given the audience a way to question us, which made the demonstration much more convincing than another explanation of what our platform could eventually do.
Italy lost 1–0. From the INNAAS side of the room, though, the afternoon gave us something to build on.
TIM bought the technology behind the demo and used it for TIM Stadium. We went on to work on football performance analysis for TIM's activities with Lega Serie A. What we had brought into the room as a demonstration became a product responsibility: the analysis had to keep working after the people from the startup had finished presenting it.
The commercial relationship also led to investment. On 22 April 2015, TIM Ventures announced a €100,000 investment in INNAAS. Having a large company use our work, and then invest in the company producing it, mattered enormously to us at that stage.
I remember the youthful determination behind the whole exercise. We wanted a chance to show what we could build, and we were willing to spend our own money to make the demonstration happen. We chose a subject people understood well enough to judge us immediately.
When I think about that first project, I come back to the two screens. All our complicated work was on one of them. On the other, twenty-two players were giving it a fairly unforgiving test.